Using XSCOPE for fast “printf debugging”
The previous example in Communicating between tiles was very slow due to the time taken
to print each line of text to the terminal. This is made particularly noticable
if the value of ITERATIONS is increased.
This default behaviour can be slow for a number of reasons:
A JTAG interface is being used to control the transfer.
There is no buffering for the transferred data.
The data is transferred via the debug kernel. All running logical cores on a tile are halted whilst the transfer on a given logical core completes.
It is clear to see that the default behaviour can play havoc if the application being debugged has any real-time constraints. To mitigate this problem, the XSCOPE interface is provided.
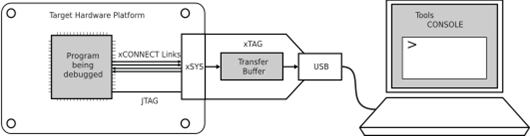
XTAG debug setup showing JTAG and xlink connections
The XSCOPE interface makes use of a physical high bandwidth XLINK connection to the XTAG debugger. Buffering is provided on the XTAG debugger itself. Through this mechanism there is no need to halt all the logical cores whilst another conducts a transfer.
The net result is that XSCOPE can be used as a high performance debug interface with minimal impact on the real-time performance of the application under examination. Use of XSCOPE is thus recommended in almost all cases.
Configuring and using XSCOPE
This example presumes that we are using XSCOPE to accelerate debug of the previous example: Communicating between tiles.
XSCOPE is configured by creating an XML XSCOPE config file with the
suffix: .xscope. Here we create the most basic configuration file:
<xSCOPEconfig ioMode="basic" enabled="true">
</xSCOPEconfig>
XCC recognises files with this suffix. The file is provided to XCC as an argument during building (specifically during the link step if compiling and linking as separate build steps):
xcc -target=XCORE-200-EXPLORER basic.xscope mapfile.xc main.c
Now run the application using xrun --xscope (not
--io as previously used):
xrun --xscope a.xe
The printed output is now produced seemingly instantaneously. Try increasing the
value for ITERATIONS.
Important
Use of XSCOPE on one or more logical cores of a tile results in a single channel end being allocated for use by XSCOPE.
Tip
Try changing ioMode from basic to timed. This causes
the output timestamp to be displayed with the printed data in the console.
Note that this also reduces the amount of data that can be buffered at any
time.
Warning
An alternative approach for configuring XSCOPE used the
xscope_user_init() function. This approach has since been deprecated.
Using XSCOPE “probes”
As well as using XSCOPE to accelerate literal “printf debugging” as above, XSCOPE “probes” can be used to send named streams of data to the host for debugging purposes. These might be streams of ADC samples, say.
The underlying mechanism used for XSCOPE probes is the same as that used by the
calls to printf() above. Probes however are even more efficient, as they
avoid overheads both in CPU time and data transfer.
Probes are added into the XSCOPE config as follows:
<xSCOPEconfig ioMode="basic" enabled="true">
  <Probe name="Tile0-result" type="CONTINUOUS" datatype="UINT" units="mV" enabled="true"/>
  <Probe name="Tile1-i" type="CONTINUOUS" datatype="UINT" units="mV" enabled="true"/>
  <Probe name="Tile1-accumulation" type="CONTINUOUS" datatype="UINT" units="mV" enabled="true"/>
</xSCOPEconfig>
With XSCOPE probes now configured, they can be exploited by adding the
highlighted modifications into main.c:
#include <stdio.h>
#include <xcore/channel.h>
#include <xscope.h>

#define ITERATIONS 10

void main_tile0(chanend_t c)
{
  int result = 0;

  printf("Tile 0: Result %d\n", result);
  xscope_int(0, result);

  chan_out_word(c, ITERATIONS);
  result = chan_in_word(c);

  printf("Tile 0: Result %d\n", result);
  xscope_int(0, result);
}

void main_tile1(chanend_t c)
{
  int iterations = chan_in_word(c);

  int accumulation = 0;

  for (int i = 0; i < iterations; i++)
  {
    accumulation += i;
    printf("Tile 1: Iteration %d Accumulation: %d\n", i, accumulation);
    xscope_int(1, i);
    xscope_int(2, accumulation);
  }

  chan_out_word(c, accumulation);
}
Build similarly to before:
xcc -target=XCORE-200-EXPLORER probes.xscope mapfile.xc main.c
This time, when running, add --xscope-file to
specify a file to write the probe output into:
$ xrun --xscope --xscope-file xscope.vcd a.xe
A standard VCD file xscope.vcd is produced in the current directory,
which can be opened with any 3rd-party VCD viewer. One option is
GTKWave. To use gtkwave to view
the VCD file:
$ gtkwave xscope.vcd
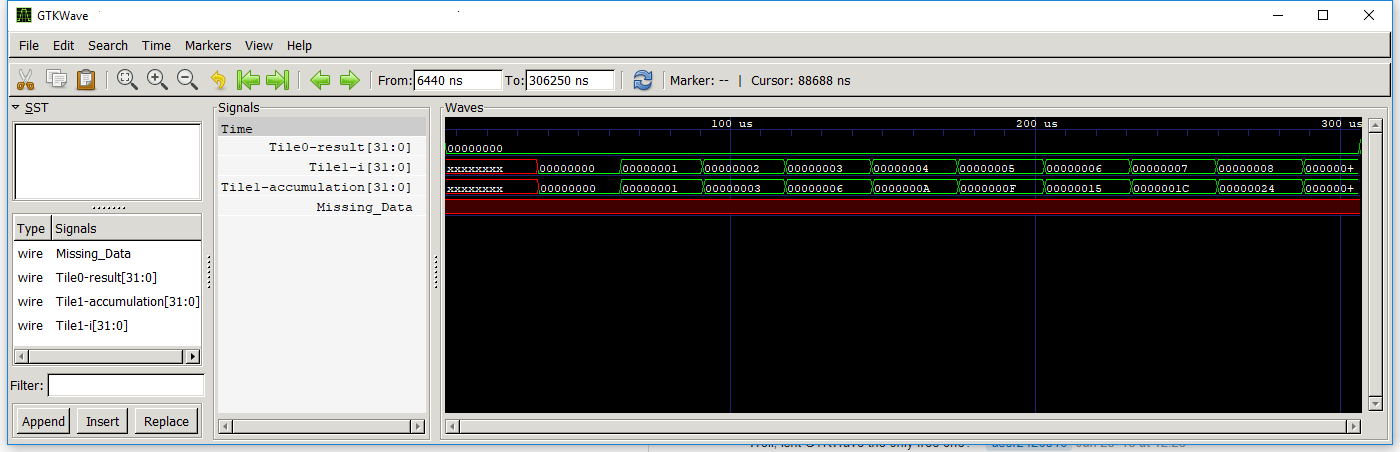
After ‘dragging’ the signals into the viewing area, the display might look like this:
Installation and use of GTKWave or other VCD viewers is outside the scope of this document.
Note
XScope tracing as described in this example can be performed using XSIM.
Summary
You can now use the XScope facility to perform “printf debugging”. In fact, this
method (using xrun --xscope) should always be the preferred approach,
instead of the default approach (using xrun --io) shown in previous
tutorials.